A calibration object for anonymous IR markers: from the white threshold to the optimal shape
Retro-reflective spherical markers, monochrome cameras, threshold detection
Simone Tortorella · October 2026
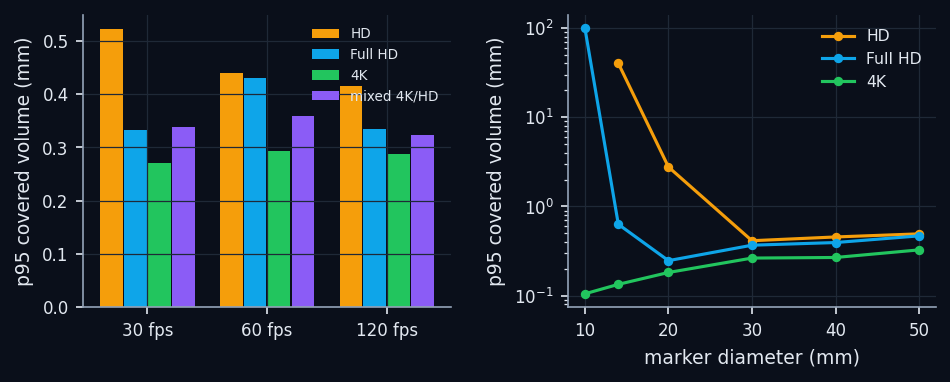
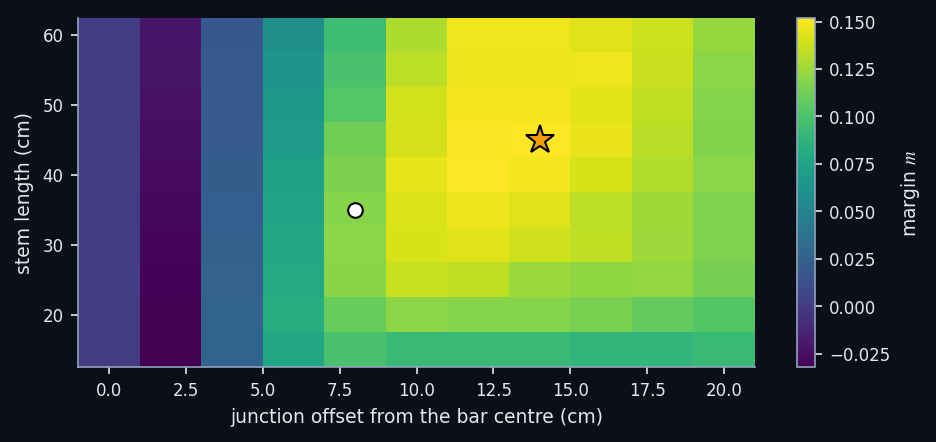
We study the object used to calibrate a system of 8 monochrome cameras with an infrared illuminator and retro-reflective spherical markers, whose centres are estimated as centroids of the pixels above a white threshold. A pixel-level model of the marker (retro-reflective profile, PSF, motion blur, noise, compression) shows that with a dark IR background the centroid error is about 0.011 px for an 8 px marker at a 40% threshold, and that the dominant error is not noise but partial occlusion (0.82 px when a third of the disc is covered). In full simulations (a person moving the object, 8 cameras, bundle adjustment) we compare resolution (HD, Full HD, 4K), frame rate (30–120 fps), marker diameter (10–50 mm), six object designs and the static terna. The marker should be the smallest the resolution allows, about 3 px at the median distance: 30 mm in HD, 20 mm in Full HD, 10 mm in 4K. To recognise the object from anonymous points we define an identification margin and optimise it: a 4-marker T with the junction 14 cm off-centre and a 45 cm stem maximises the margin; 5–6 marker variants are not more robust. The construction tolerance of the static terna is the main limit of the absolute accuracy: 0.25 mm of tolerance takes the p95 from 0.68 to 1.62 mm.
Keywords: multi-camera calibration · infrared markers · blob centroid · threshold · T-wand · unlabelled marker identification
1. Introduction
Marker-based motion analysis systems use monochrome cameras with a ring of infrared LEDs around the lens and a filter that passes only infrared light. The markers are spheres covered with retro-reflective material: they send the light back to the camera and appear in the image as almost white discs on an almost black background. The centre of each marker is estimated with a white threshold and the centroid of the pixels above it. The cameras do not know which marker a blob belongs to: they only see anonymous points.
The calibration proposed in a previous study uses a 3D terna standing still at the origin (it defines origin, axes and scale) and a T-wand moved by a person through the volume (it constrains intrinsics, extrinsics and delays through a sparse bundle adjustment). Here we answer a more concrete question: what the object should look like, and which marker and camera parameters really matter. Every test is a simulation with known ground truth: the estimated calibration is always compared with the true one.
- §2 pixel model of the marker and of threshold detection;
- §3 from pixel to millimetre: resolution, fps and marker diameter in full calibrations;
- §4 recognising the object from anonymous points: identification margin and its optimisation;
- §5 the static terna; §6 the ideal object.
2. The marker as the camera sees it
A retro-reflective sphere of apparent diameter pixels, lit by the coaxial ring, has an almost flat intensity profile in the image that drops near the rim. We model it as
with background and gain (the centre saturates at 255). The image is 8× super-sampled, convolved with the lens PSF (Gaussian, px) and with the motion blur of the exposure, integrated over the pixels, with photon noise (6000 e⁻ at white) and read noise (2 DN), quantised to 8 bits. The detector applies a threshold (fraction of white), finds connected components and computes their weighted centroid:
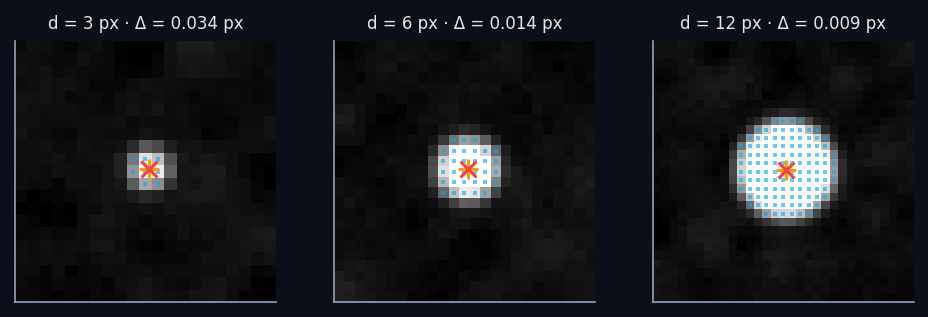
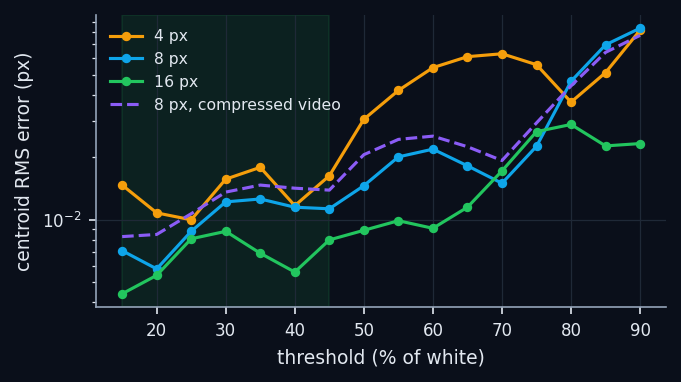
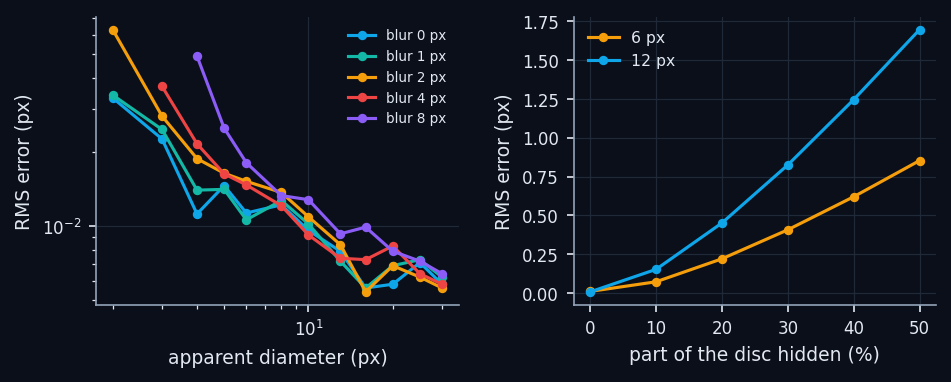
Two nearby markers merge into one blob when the distance between their centres falls below about 1.05 apparent diameters (simulation, 40% threshold). Finally, an error component the model does not contain (residual of the distortion model, rolling shutter, vibration, non-uniform material) is represented in the following simulations by a term px added in quadrature; Paper 3 studies the sensitivity to it.
3. From pixel to millimetre: resolution, fps, diameter
Each full simulation has 8 cameras on the walls of a 6×6 m room, at two alternating heights (2.4 and 1.0 m), with the narrowest lens that frames the 3.5×3.5×2 m volume (here always 120°, focal length 554 px at Full HD). A person walks for 20 s moving the T; the bundle adjustment uses 400 frames; one frame in five is kept aside for validation. The main metric is the p95 of the 3D error inside the part of the volume crossed by the T ("covered volume"), triangulating exact observations with the estimated cameras. The apparent diameter of a marker is : a 30 mm sphere at 3.6 m (median distance) measures
| Diameter | HD | Full HD | 4K | 4K at 5.1 m |
|---|---|---|---|---|
| 10 mm | 1.0 | 1.5 | 3.1 | 2.2 |
| 14 mm | 1.4 | 2.2 | 4.3 | 3.0 |
| 20 mm | 2.1 | 3.1 | 6.2 | 4.3 |
| 30 mm | 3.1 | 4.6 | 9.3 | 6.5 |
| 40 mm | 4.1 | 6.2 | 12.4 | 8.6 |
| 50 mm | 5.2 | 7.7 | 15.5 | 10.8 |
4. Recognising the object from anonymous points
In every image the program has to say which blob is which marker. The object is planar: its image is a projective transform of the drawing, well approximated by an affine one when the object is small compared with the distance. For an assignment of the blobs to the drawing markers , the normalised residual of the best affine fit is
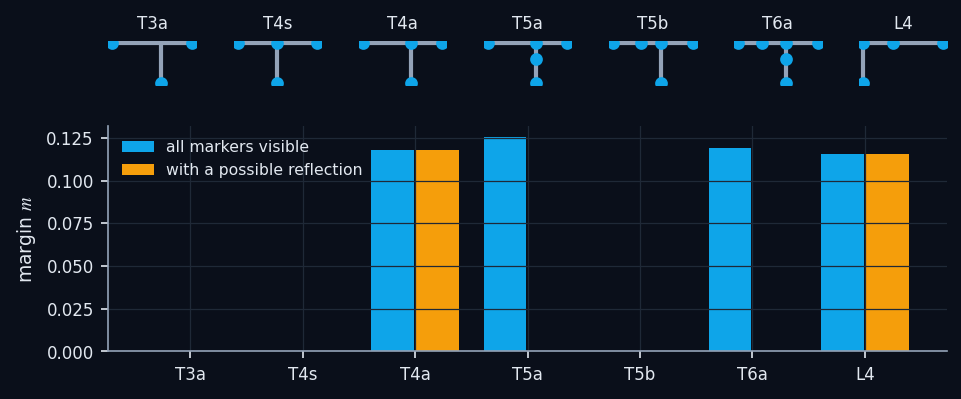
An affine map has 6 degrees of freedom: with 3 markers every permutation has zero residual and there is nothing to check; with a symmetric drawing the left/right reflection is an exact affine map too. We define the identification margin as the difference between the best residual of a wrong labelling and that of the right one, at the 10th percentile over 200 viewpoints with up to 70° of tilt:
The margin is dimensionless (a fraction of the object's size in the image): the labelling stays safe as long as the centroid noise, divided by the object's size in pixels, is much smaller than . With the hypothesis of a ghost blob (reflection) we also consider labellings that drop one marker.
5. The static terna
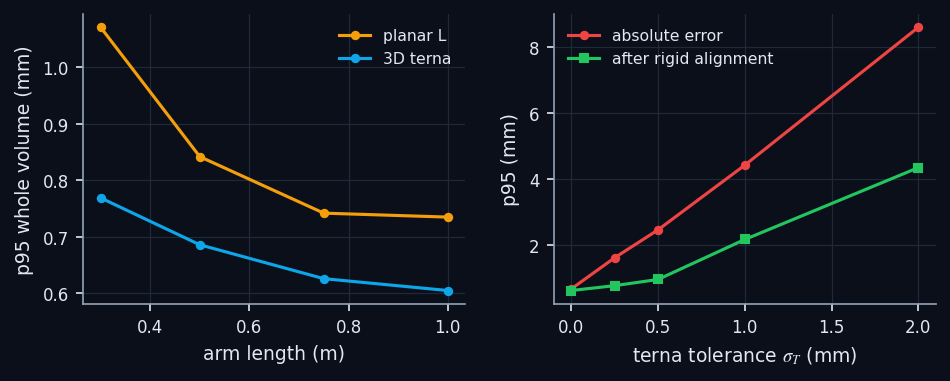
The terna standing at the origin fixes the reference frame and gives the initial camera estimate (PnP). We compare a planar L (two arms on the floor) and a 3D terna (three orthogonal arms), with arms from 0.3 to 1.0 m and 40 mm markers, and the effect of a construction tolerance (random deviation of each marker from its design position).
6. The ideal object and conclusions
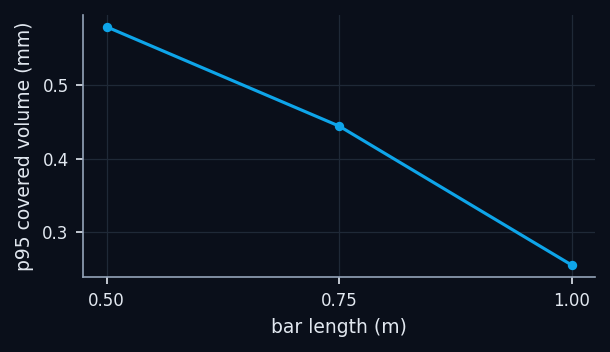
- T-wand with 4 retro-reflective spheres, 0,75–1,0 m bar, junction and stem 14 cm off-centre, 45 cm stem (margin 0.152).
- Marker diameter: the smallest that gives about 3 px at the median distance (Table 1): 30 mm in HD, 20 mm in Full HD, 10 mm in 4K (120° lenses in a 6 m room). Bigger does not help.
- Distance between markers ≥ 3 diameters: blobs merge below 1.05 apparent diameters and at a 70° grazing angle distances shrink to a third.
- White threshold 40% (useful window 15–45%), weighted centroid, rejection of non-circular blobs.
- 3D terna with 0.75 m arms, 40 mm spheres, built or measured within 0.1–0.2 mm.
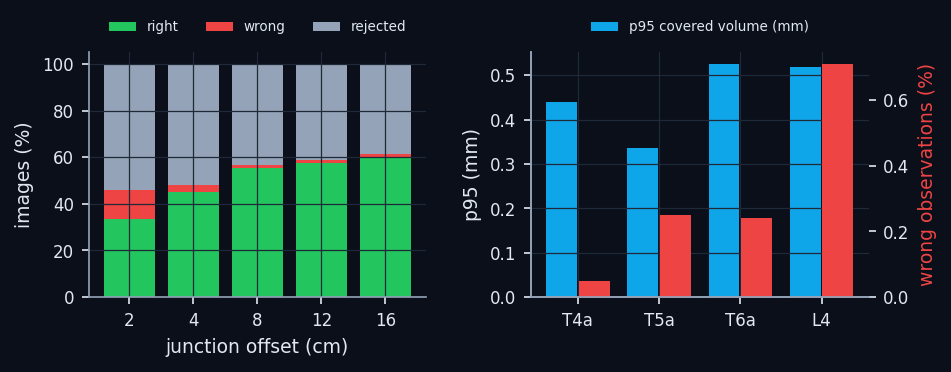
- 5–6 markers or markers of different sizes are not needed: they increase ambiguity with reflections.
The least intuitive result is that bigger markers are not better: above the detectability limit the dominant error is partial occlusion, which in millimetres is proportional to the diameter of the sphere. The second is that recognition from anonymous points can be designed: the identification margin gives a quantitative criterion to choose the shape, and rewards a strongly asymmetric 4-marker T over objects with more markers.
Limits: the marker model does not contain non-uniform material, specular reflections at the rim, rolling shutter; the unmodelled error is summarised by . The 120° lenses are imposed by a 6 m room with wall-mounted cameras; with narrower lenses the recommended diameters scale with the focal length.
References
- Z. Zhang, A flexible new technique for camera calibration, IEEE Trans. PAMI 22(11), 2000.
- R. Hartley, A. Zisserman, Multiple View Geometry in Computer Vision, 2nd ed., Cambridge University Press, 2004.
- B. Triggs, P. McLauchlan, R. Hartley, A. Fitzgibbon, Bundle adjustment — a modern synthesis, Vision Algorithms: Theory and Practice, LNCS 1883, 2000.
- M. R. Shortis, T. A. Clarke, T. Short, A comparison of some techniques for the subpixel location of discrete target images, Proc. SPIE 2350, Videometrics III, 1994.
- T. Svoboda, D. Martinec, T. Pajdla, A convenient multicamera self-calibration for virtual environments, Presence 14(4), 2005.
- W. Kabsch, A solution for the best rotation to relate two sets of vectors, Acta Crystallographica A32, 1976.